
Pesticide Risk in Textile Supply Chains: How to Measure
Pesticides in cotton and flax production are regenerative farming's blind spot. How to measure their real toxicity risk across textile origins.

A textile brand can today document the soil organic matter content of its cotton-growing areas, cover crop adoption between cash crops, replanted hedgerows and the carbon balance per hectare. And know nothing about the toxicity of the molecules sprayed on those very same fields.
This gap is far from trivial. Fibre is one of the agricultural productions where pesticide pressure has historically been highest, and where treatment programmes vary massively from one growing basin to another. Yet in most regenerative agriculture programmes deployed in textile upstream supply chains, the topic is still handled with a tick box — compliance with a banned-substance list — or with an indicator of applied quantities.
Applied volume, a misleading unit of measurement
The most widespread indicator is also the most fragile: quantities of product applied per hectare. It is simple to collect, easy to display in a report, and reassuring when the curve goes down.
But it adds up things that are in no way comparable. Identical quantities can correspond to substances whose intrinsic hazard, persistence in the environment and mobility towards water bodies differ by an order of magnitude. A drop in applied quantities can therefore go hand in hand with a rise in actual risk, if substitution has shifted towards molecules of greater concern.
This is precisely what a hazard-weighted assessment corrects: each application is weighted according to the intrinsic hazard of the molecules involved, their persistence and the exposure pathways — not according to the mass applied. Two programmes with identical applied quantities can then show very different levels of risk.
Sans pondération par le danger, l'écart de risque entre deux exploitations engagées dans le même programme régénératif reste invisible. Et tant qu'il est invisible, aucune priorité d'action ne peut être fixée : ni sur les origines, ni sur les substances, ni sur les types de risque.
What regenerative standards do not measure
Regenerative agriculture standards have been built around three measurement pillars: soil, carbon, biodiversity. These are solid pillars, with protocols that are professionalising fast — soil analyses, cover crop monitoring, beneficial insect inventories.
The toxicity of the molecules applied, on the other hand, is in practice handled through declarative requirements: a list of prohibited substances, sometimes a watch list. A farm can comply with that list while running a programme heavily loaded with substances classified as hazardous to aquatic environments or to pollinators.
This is not a criticism of the standards, it is an observation about scope. Where they measure soil health, carbon and biodiversity infrastructure, the toxicological layer measures something else: the risk of the programmes actually applied — for water, soil organisms, pollinators and human health. It is complementary, not competing: it plugs into the same field-level data and fills the missing box, without duplicating the soil measurement already carried out.
The first blind spot: metabolites and PFAS
Regulatory lists think in terms of active substances. Yet an authorised substance can degrade into metabolites that are persistent or mobile in water bodies — compounds that are themselves problematic, and that appear nowhere in supplier compliance grids.
The same reasoning applies to fluorinated active substances belonging to the PFAS family. The topic is rising fast on the European regulatory agenda and on that of textile buyers, but it requires a molecular reading of programmes: you cannot handle it with a list of trade names.
The relevant reading therefore cross-checks each declared substance against several reference frameworks in parallel: European banned lists and candidates for substitution, WHO acute hazard classification, hazard statements for aquatic environments and pollinators, PFAS status, and the behaviour of primary and secondary metabolites.

Several types of risk, not a single score
A single overall score is comfortable for communication and dangerous for decision-making: it masks risk transfers — a strategy that protects water can worsen operator exposure; a reduction in herbicides may be paid for with more intensive tillage.
This is why the assessment is broken down by risk type, each carried by a dedicated indicator:
- risk to water and aquatic environments;
- risk to biodiversity and non-target organisms — pollinators, aquatic fauna, birds and soil organisms;
- acute risk to operators;
- chronic risk to human health.
This granularity changes the nature of the conversation. The question is no longer "is it better?" but "better for whom, and at whose expense?". It is what allows a procurement department to set an explicit priority — for example, reducing operator risk first in the origins where personal protective equipment is hardest to guarantee.
Simulate before writing it into a specification
The classic mistake is to write a requirement into a supplier specification before having measured its effect. A poorly calibrated exclusion clause can be unworkable in certain origins, or produce a substitution that shifts risk instead of reducing it.
Starting from the programmes actually applied, it becomes possible to test scenarios: what does a programme without the most critical substances look like? What risk reduction can be expected, risk type by risk type? Which origins can absorb it without technical disruption?
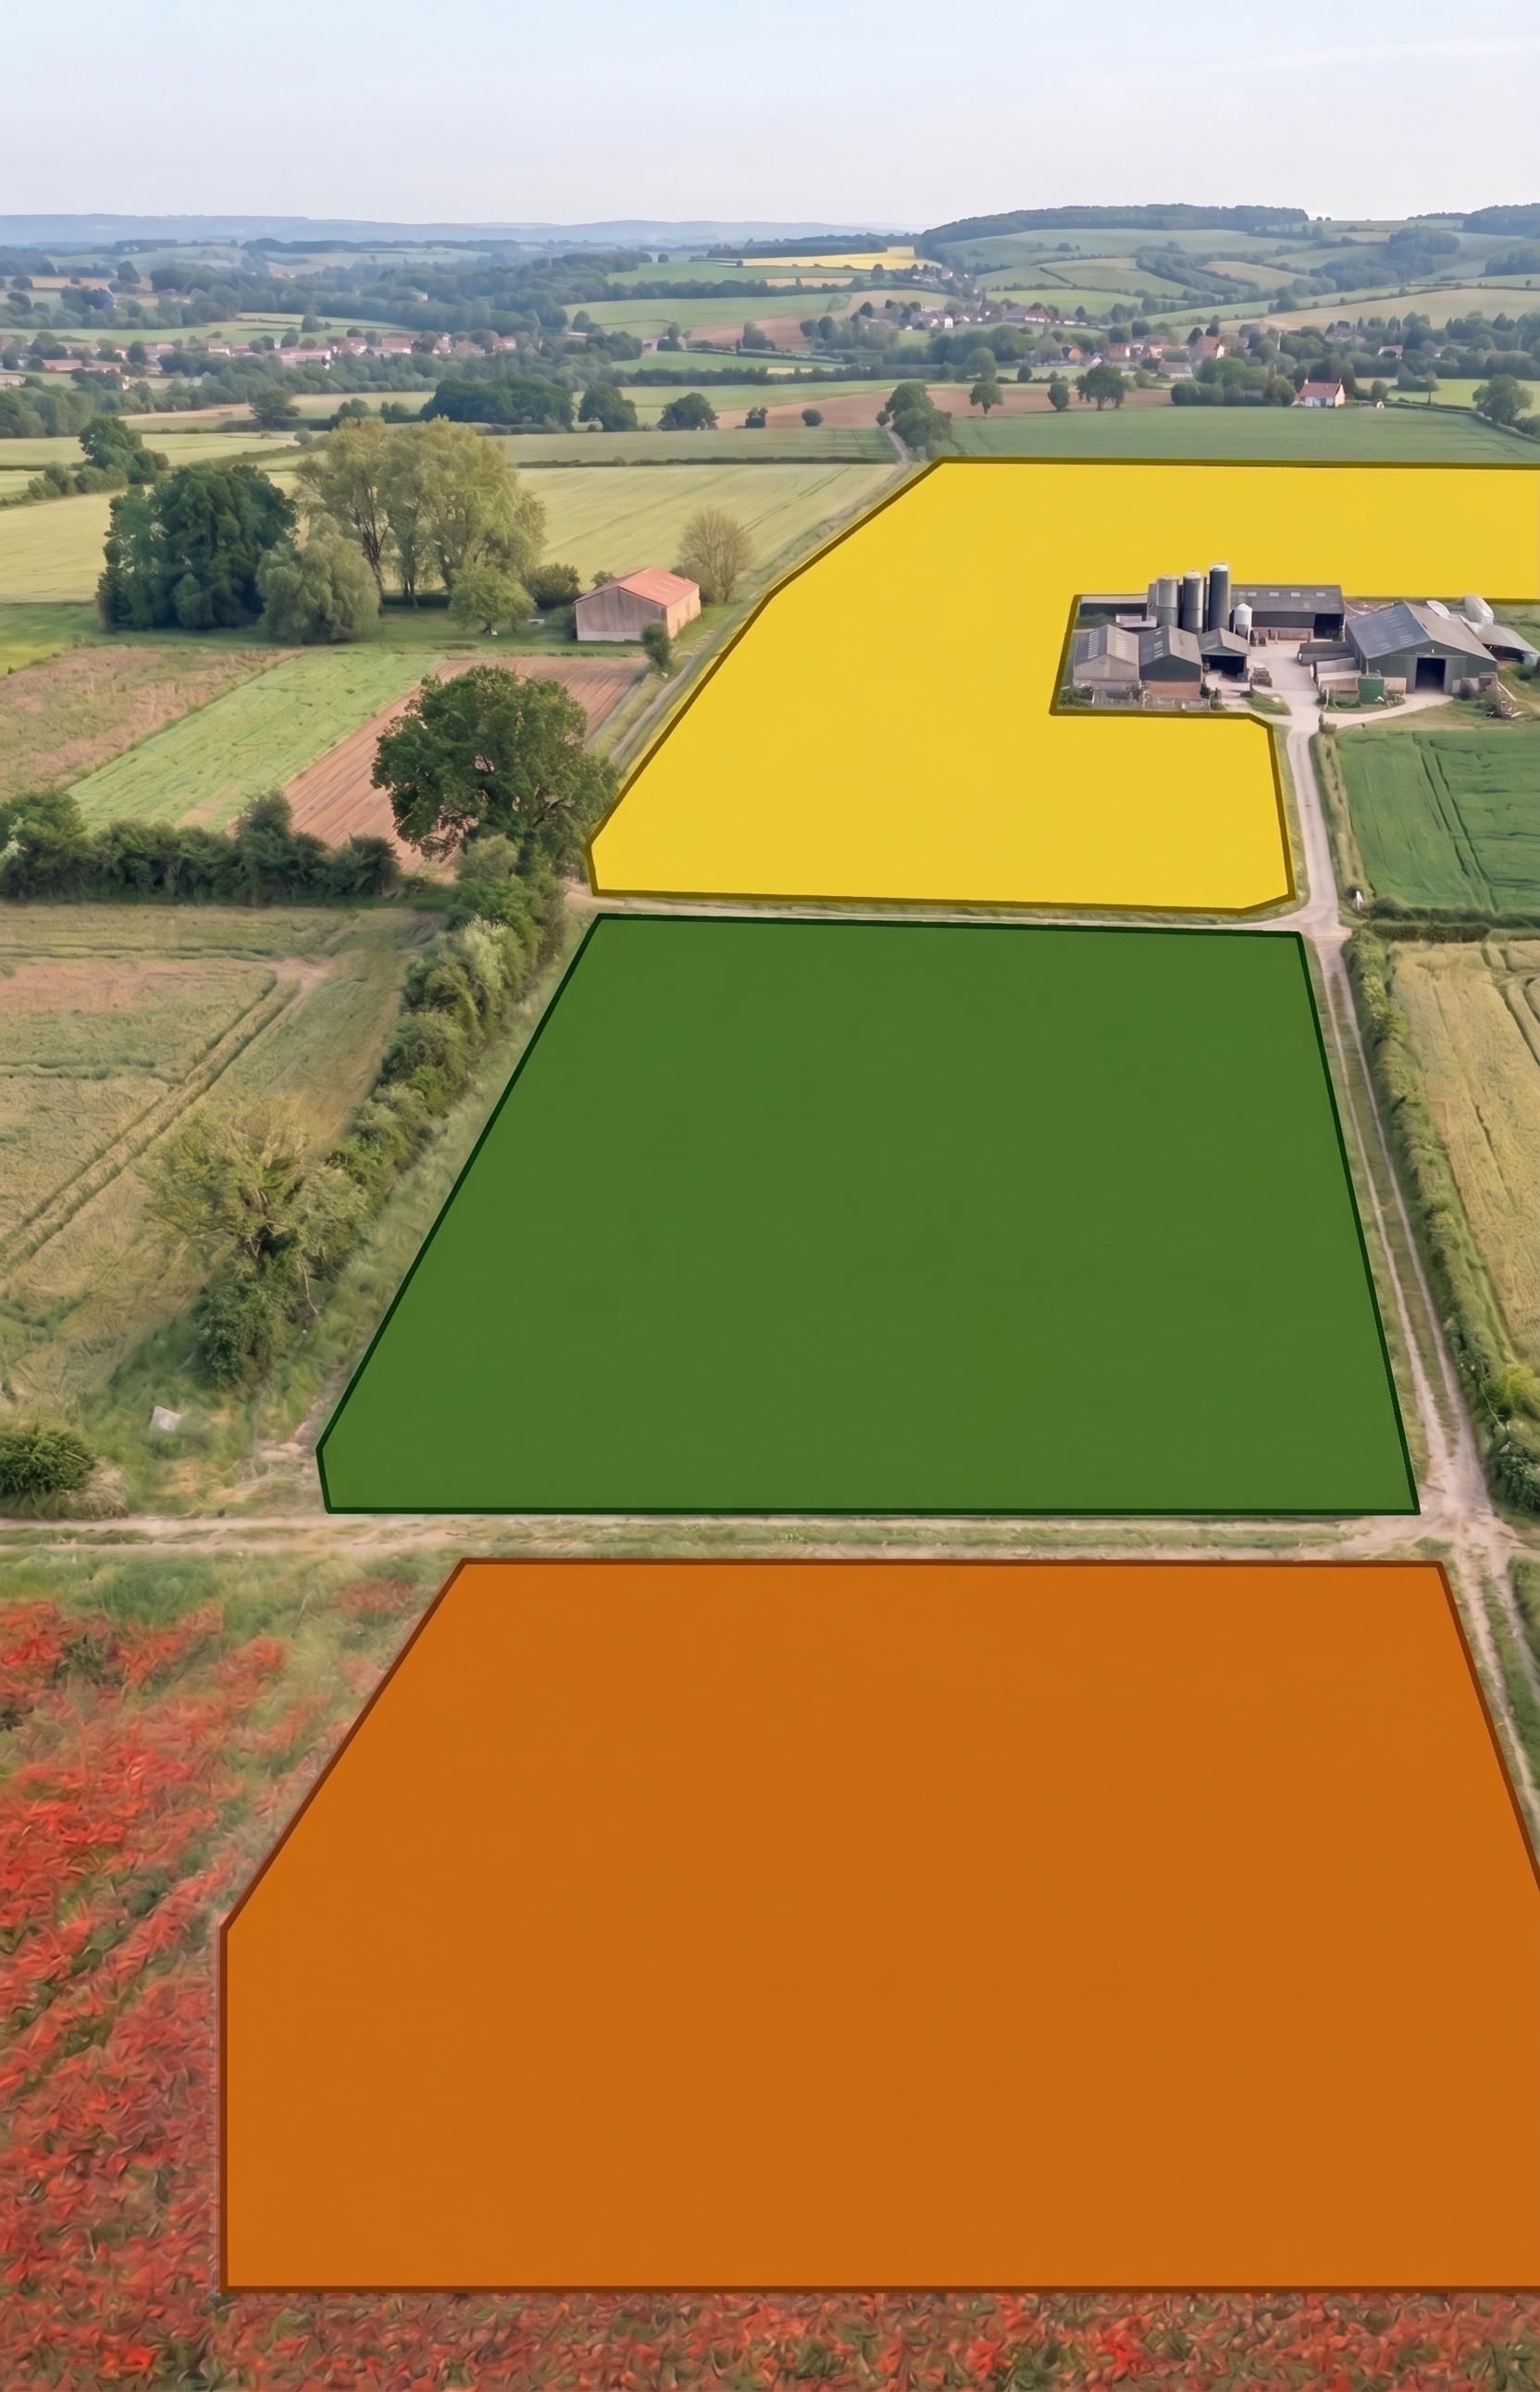
This simulation step transforms the relationship with the upstream supply chain: the requirement arrives documented, with a quantified gain and a trajectory, rather than as a blunt ban.
The real lever sits with the adviser and the grower
An indicator that stays in a head-office dashboard reduces no risk. Reduction happens at the level of the treatment decision: choice of molecule, number of passes, the role of biocontrol, rotation length, management of application conditions.
Hence the value of making the indicator usable by advisers and growers themselves: they test the effect of their strategy, see which type of risk weighs most heavily in their programme, and are offered alternatives assessed on the same basis — an essential condition for not simply moving the problem elsewhere.

Sans évaluation des alternatives proposées, un conseil de substitution est un pari. C'est le mécanisme qui a produit, dans plusieurs filières, des transferts de risque documentés a posteriori : un problème résolu sur un compartiment, un autre créé ailleurs.
Comparing origins that do not play by the same rules
A fibre supply chain rarely sources from a single country. Approvals, practices, application conditions and worker protection levels differ strongly from one origin to another.
Comparing these origins on the basis of local compliance therefore makes no sense: each one complies with its own framework. Comparability requires a single assessment grid, applied to the programmes actually implemented, independently of local regulatory status — and kept up to date, because European reference frameworks change from year to year.
It is this comparability that makes two very concrete things possible: ranking origins by risk level, and tracking an improvement trajectory over time rather than a snapshot at a given moment.
CSRD and due diligence: moving from declaration to evidence
Reporting and due diligence obligations have raised the bar. Declaring an exclusion policy is no longer enough; you have to document risk identification, the measures taken and their effects, supply chain included.
On the pesticide side, this means being able to produce three things: the risk level of the programmes applied in your sourcing areas, the method used to establish it, and how that level evolves from one season to the next. Exportable results, reusable in supplier reviews as well as in reporting, avoid rebuilding the exercise every year.
Where to start
Three steps are enough to move beyond applied quantities as the only indicator.
- Collect the programmes actually applied on a representative sample of your fibre origins — substances, number of applications, timing. The data often already exists in audits or field records.
- Establish a baseline by risk type, origin by origin, to identify where risk is concentrated and which type dominates.
- Simulate an improvement scenario before writing it into contracts, checking that it does not worsen any other type of risk.
The takeaway is simple: as long as toxicity is not measured, a regenerative programme remains incomplete on its most sensitive dimension for health and for water. Our pesticide risk indicators plug into the data you already collect, as a complement to your certifications and your soil, carbon and biodiversity indicators — to make the missing box visible, and manageable.